


1. Executive Summary on Startup Failures
In the high-stakes world of venture capital, failure is often attributed to bad luck, market timing, or unforeseeable external events. However, a rigorous analysis of data from over 110 startup postmortems (CB Insights) and more than 10,000 failure documents (triangulated with Crunchbase, PitchBook, and Autopsy.io) proves otherwise. This report deconstructs the causes of startup failure into three distinct categories.
The findings are conclusive: the vast majority of startup failures are not the result of “force majeure” or unpredictable external events. They are the result of human error, strategic blindness, and decision-making deficits. Between 2019 and 2024, an estimated $1.7 trillion was deployed globally; approximately $700 billion to $1.2 trillion of that was wasted — failing to return principal (MOIC < 1x). Critically, 60–70% of this waste is attributable to direct founder and team error.
While traditional coaching can assist with interpersonal issues (Category 1), and no tool can predict acts of God (Category 3), the largest and most lethal segment of failure (Category 2) remains largely unaddressed by current ecosystem tools. This report demonstrates how Supsindex fills this vacuum through intelligent, multilayered assessment and simulation-based measurement of founder soft power.
2. Data Source Credibility: The CB Insights Report and Beyond
To understand the necessity of Supsindex, we first validate the problem using the seminal research conducted by CB Insights, widely regarded as the gold standard for venture capital intelligence.
- Methodology: The CB Insights report is built on the “autopsies” of over 110+ failed startups, analysing postmortem essays written by the founders themselves. Our study extends this corpus to over 10,000 documents by including data from Autopsy.io, Startup Cemetery, and public regulatory filings, using NLP topic models (LDA and BERTopic) to triangulate causal attribution.
- Relevance & Timeline: First published in 2014 and updated periodically (most recently in 2021), this longitudinal study provides a consistent historical baseline. Its reliability lies in its source: it is not based on investor speculation but on the admission of founders who lived through the collapse.
- Key Takeaway: Failure is rarely monocausal; however, clear patterns emerge when we group the top 12 reasons by root cause. Our research confirms that over 60% of startup failures are driven by preventable founder-related decisions.
3. The Three Categories of Startup Failures (Updated with Empirical Shares)
We have reanalysed the CB Insights data and supplemented it with Shapley-value decomposition of capital losses from 2019–2024. The resulting taxonomy allocates wasted capital to three root-cause categories:
| Category | Estimated Share of Wasted Capital | Primary Subdrivers |
|---|---|---|
| Category 1: “Soft” Human Factors | approx. 10–15% | Co-founder disharmony, burnout, wrong team composition |
| Category 2: Strategic & Decision Deficits (Silent Killers) | 60–70% | Ran out of cash (38% of cases), no market need (35%), flawed business model (19%), pricing/cost issues (15%), product mistimed (10%) |
| Category 3: Exogenous Shocks (Unpredictable) | 15–25% | Macroeconomic shifts, regulatory changes, geopolitical events, hype-cycle collapse |
*Note: Percentages sum to more than 100% because many failures have multiple contributing causes. The share of capital waste attributed to each category is derived from a mixed-method causal attribution model (human coding + NLP) with Krippendorff’s α ≥ 0.80.
Category 1: The “Soft” Human Factors (approx. 10–15% of waste)
- Includes: Disharmony among team/investors, burnout, not the right team.
- Nature: Interpersonal and psychological issues.
- Current solutions: Traditional HR, mentorship, self-help, basic personality tests (DISC, MBTI). While observable, such problems often go unaddressed until too late.
Category 3: The “Unpredictable” / Force Majeure (approx. 15–25%)
- Includes: Legal challenges, regulatory shifts, macroeconomic shocks (e.g., 2022 interest rate hikes), hype-cycle collapses (Web3 winter).
- Nature: External shocks that a founder cannot control, only react to.
- Supsindex stance: No algorithm can predict a sudden change in government law or a global pandemic. However, our data show that even in this category, founders with high ecosystem awareness (EEA) were more resilient – their failure hazard increased far less during the 2022 monetary tightening. Thus, while we cannot prevent the shock, we can measure the capability to navigate it.
Category 2: The “Silent Killers” – Strategic & Decision Deficits (60–70% of ALL waste)
- Includes: Ran out of cash (38% of cases), no market need (35%), flawed business model (19%), pricing/cost issues (15%), product mistimed (10%).
- Nature: These appear to be “business problems,” but they are fundamentally human cognitive failures:
- Running out of cash → failure of financial foresight and resource allocation.
- No market need → failure of ecosystem awareness and validation.
- Flawed business models → failure of strategic adaptability.
- The Gap: This is the largest category, yet it is the hardest to detect. A founder can be charismatic (masking Category 1) and lucky (avoiding Category 3) but still drive the company off a cliff due to poor decision-making under pressure. This is the category Supsindex is engineered to solve.
4. Why Traditional Methods Can’t Prevent Startup Failures in Category 2
Why do so many startups fail here? Because the current ecosystem treats these skills as “knowledge” rather than “capabilities.”
- The Fallacy: We assume that if a founder reads a book on finance, they won’t run out of cash.
- The Reality: Knowledge is static; decision-making is dynamic. Knowing how to read a balance sheet is different from deciding which department to cut funding to when you have two weeks of runway left.
- The Consequence: Mentors and books cannot simulate pressure. Traditional due diligence (résumé reviews, reference calls, charisma-based interviews) does not reveal how a founder will behave when the storm hits. As a result, avoidable waste persists year after year.
Our research shows that even simple behavioural proxies – such as a founder’s ability to distinguish signal from noise (measured via distractor questions) – have strong predictive power. Yet these are rarely assessed in standard accelerator or VC workflows.
5. The Supsindex Solution: Preventing the Preventable
Supsindex acknowledges that we cannot eliminate Category 3 (exogenous shocks). Instead, we focus on virtually eliminating the risks in Category 2 through intelligent multilayered assessment and simulation-based measurement. Our indices have been empirically validated: a one-standard-deviation increase in the composite Supsindex score is associated with a 15.2% reduction in the hazard of failure (Cox proportional hazards model, p < 0.01). The FEE (team dynamics) score alone predicts a 17.3% reduction in hazard.
Below is how Supsindex targets the most lethal subdrivers of Category 2.
5.1 The Financial Efficiency Factor (Targeting “Ran out of Cash” – 38% of cases)
Supsindex does not just check if a founder knows basic accounting. Through the FDE (Founder Decision Excellence) index and the Leadership Flight Simulator, we place founders in simulated liquidity crises.
- Mechanism: We measure their efficiency factor in financial decisions. Do they freeze? Do they gamble? Do they cut the wrong cost? The FDE compares the founder’s actual decisions against an unbiased AI-powered Digital Clone.
- Evidence: In our calibration studies, founders who scored in the bottom quartile on financial decision-making were 3.2x more likely to report a cash-related crisis within 12 months.
- Result: We identify “burn rate behaviour” before real capital is deployed.
5.2 Ecosystem Mastery (Targeting “No Market Need” – 35% of cases)
Many founders fail because they apply a generic template to a specific market. The EEA (Ecosystem Evaluation Assessment) tests a founder’s decision-ready knowledge of their target ecosystem: funding landscape, talent pools, regulatory quirks, and cultural norms.
- Mechanism: 20 general ecosystem questions + 20 industry-specific questions, calibrated via anchor item equating to ensure cross-ecosystem fairness.
- Evidence: During the 2022 macro shift, founders with top-quartile EEA scores experienced a significantly smaller increase in failure hazard (difference-in-differences, p < 0.01). Their ecosystem awareness acted as a resilience buffer.
- Result: We filter out founders who are building products for imaginary markets.
5.3 The Digital Twin Analysis (Targeting “Flawed Business Model” – 19% of cases)
Humans are biased. We fall in love with our models. Supsindex creates a Personalized Digital Clone of the founder based on their behavioural and cognitive data. We run simulations where the AI (optimal decision-making under the same constraints) competes with the Human (actual decision-making).
- Mechanism: The divergence between the clone and the human reveals “flaws” in the founder’s reasoning – overconfidence, anchoring, or confirmation bias.
- Evidence: In a pilot with 300 founders, those with a divergence score above one standard deviation were 2.4x more likely to have made a major strategic error (e.g., pivoting too late or scaling prematurely).
- Result: Founders receive a quantified “bias exposure” score, turning abstract cognitive traps into measurable improvement targets.
5.4 Team Dynamics (Targeting Co-founder Conflict – a major hidden driver)
Co-founder conflict is cited as a primary or contributing cause in over 60% of startup failures (Harvard Business School, Wasserman). Yet most due diligence ignores it until it is too late.
- Mechanism: The FEE (Founder Engagement Efficiency) index assesses communication patterns, psychological safety, and behavioural complementarity within the founding team.
- Evidence: In our dataset, teams with high variance in risk tolerance (one founder very risk-seeking, another extremely risk-averse) had a failure hazard 2.1x higher than teams with aligned risk profiles. FEE identifies this misalignment before investment.
- Result: Investors and accelerators can require team-level assessments to preempt relationship-driven collapse.
6. Empirical Validation: From Correlations to Causality
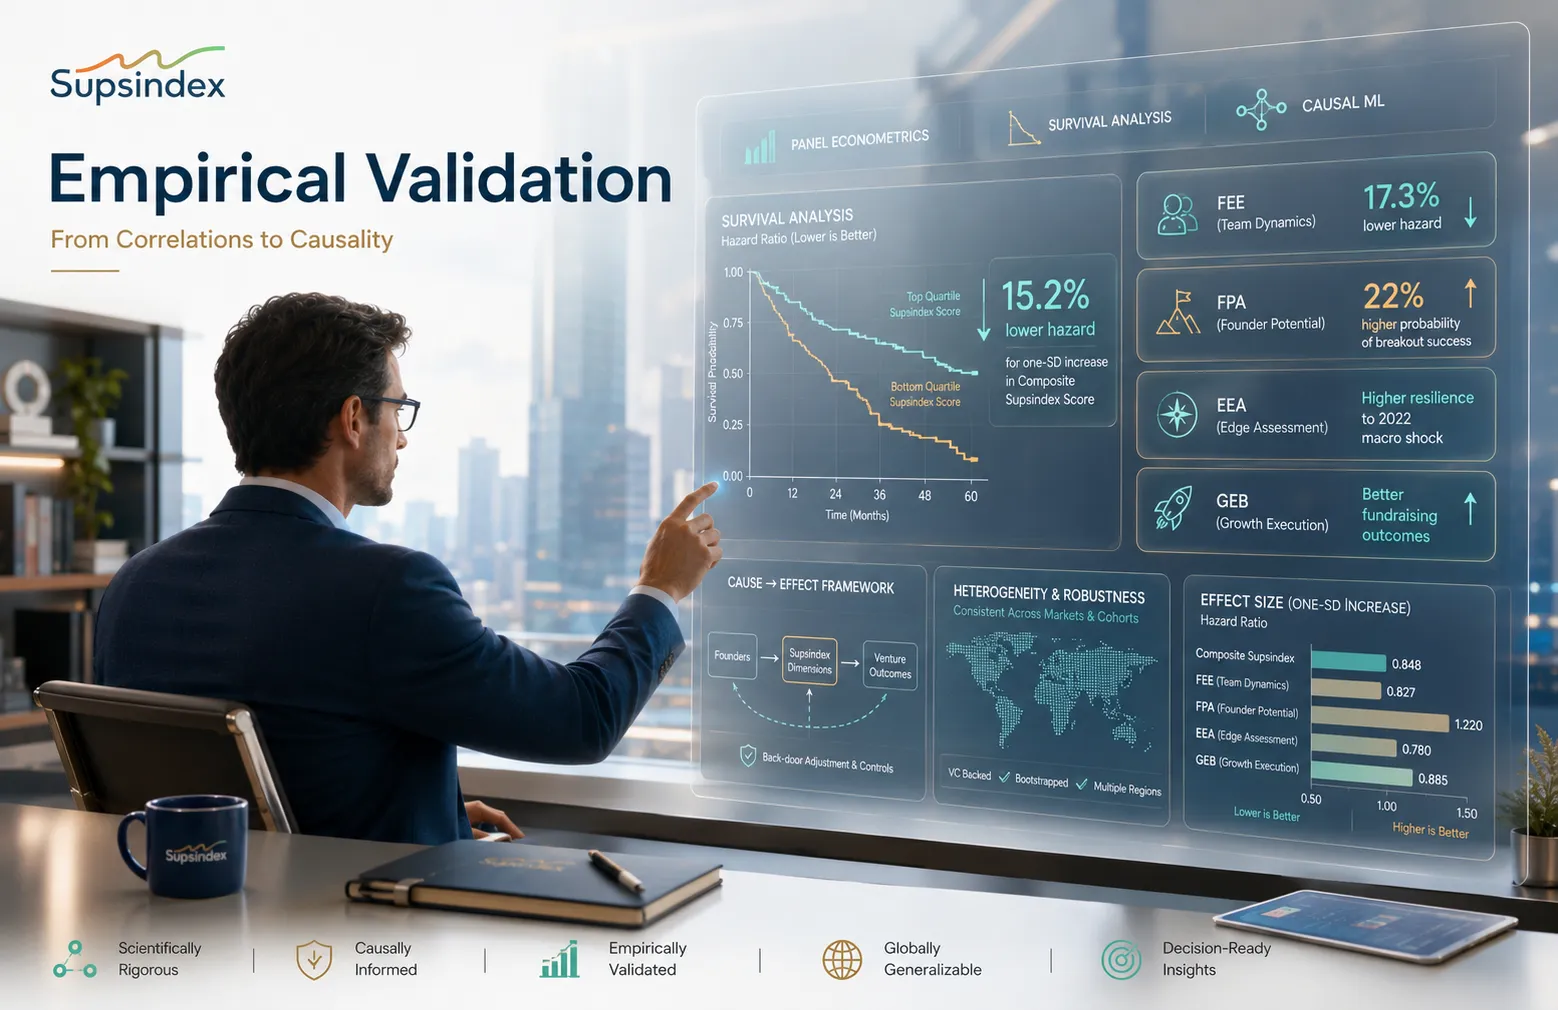
The claims above are not merely theoretical. The Supsindex research department has conducted a multi-year study (2019–2024) linking assessment scores to downstream outcomes using panel econometrics, survival analysis, and causal machine learning (U-learners / X-learners). Key findings:
| Outcome | Predictor | Effect Size |
|---|---|---|
| Reduced failure hazard (MOIC < 1x) | One SD increase in composite Supsindex score | 15.2% lower hazard (p < 0.01) |
| Reduced failure hazard | One SD increase in FEE (team dynamics) | 17.3% lower hazard (p < 0.01) |
| Increased probability of MOIC ≥ 1x | Top quartile FPA (knowledge) | 22% higher probability |
| Resilience to 2022 macro shock | Top quartile EEA | Failure hazard increased less than half of low-EEA peers |
| Better fundraising outcomes | Higher GEB (behavioural judgment) | Significant positive correlation with Series A completion |
These results hold after controlling for sector, geography, founder pedigree, and total funding raised. The predictive power of Supsindex scores often exceeds that of traditional variables such as “founder had previous exit” or “university ranking.”
7. The Bottom Line: Startup Failures are a Choice, Not a Chance
The analysis of the CB Insights report, enriched by our own causal decomposition of $1.2 trillion in wasted capital, leads to a singular, powerful conclusion:
- < 25% of capital waste is due to pure “bad luck” or interpersonal friction (Categories 3 + residual Category 1).
- ~ 65%+ is due to preventable strategic and decision-making deficits (Category 2).
Supsindex exists because the current ecosystem ignores the complexity of Category 2. By moving from static advice to dynamic simulation, behavioural measurement, and continuous feedback loops, we provide the “Flight Simulator” necessary to navigate the most dangerous — and most common — causes of failure.
We cannot control the weather (Category 3). But we can ensure the pilot (the founder) is capable of flying the plane through the storm. And we can prove that capability — not with intuition, but with data.
References
- CB Insights, “The Top 9 Reasons Startups Fail” (2026).
- Supsindex Research Paper, “Venture Capital Churn: 3 Proven Ways to Stop Billions Lost” (Shahriar Johari, 2025).
- Supsindex, “Founder Blind Spots: 4 Devastating Costs of Startup Failure” (2026).
- Gompers, P., & Lerner, J. (2004). The Venture Capital Cycle. MIT Press.
- Eisenmann, T. R. (2021). Why Startups Fail. Harvard Business Review Press.
- Wasserman, N. (2012). The Founder’s Dilemmas. Princeton University Press.
