


An FPA report is most useful when it is read as a diagnostic map rather than a grade. Scores, benchmarks, quartiles, behavioral patterns, cognitive results, and recommendations each answer different questions about founder readiness.
How to Read Your Supsindex Assessment Report: Scores, Benchmarks, and Next Steps
Receiving a founder assessment report creates an unusual problem: suddenly, a large amount of information about your entrepreneurial knowledge, cognitive patterns, behavioral tendencies, and development priorities is sitting in front of you, but knowing what to do with it is not always obvious.
A total score is easy to notice. It is also one of the easiest parts of the report to overinterpret.
The purpose of a Supsindex FPA report is not to reduce a founder to a single number or divide people into those who have “passed” and those who have “failed.” The report is better understood as a diagnostic map. It shows where your entrepreneurial knowledge is strong, where it falls behind relevant peers, how different dimensions of your cognitive profile interact, and which gaps may deserve attention before they become operational problems.
The current FPA sample report illustrates this through a fictional Seed-stage HealthTech founder, Jordan Rivera. The executive summary shows an overall score of 762 out of 1,000, alongside a cohort average of 560 and a Top 10% benchmark of 810. The same page immediately adds three cognitive scores—Recall at 74%, Relational at 81%, and Judgment at 68%—plus an 83% Founder Focus score.
Those numbers answer different questions.
Learning how to distinguish them is the first step toward reading the report correctly.
Start with context before you look at the score
Before interpreting any number in an FPA report, look at the founder context attached to it.
In the sample report, the founder is assessed as a Seed-stage HealthTech founder. That information is not decorative. Supsindex’s FPA architecture is contextual rather than purely universal, and the platform’s current methodology benchmarks founders within contextual groups that can incorporate industry, startup stage, and target ecosystem.
This matters because a score has much less meaning without knowing what the comparison represents.
A founder who understands fundraising exceptionally well for a pre-seed company may still have substantial gaps relative to what would be expected from somebody running a more mature venture. Similarly, the knowledge demanded from a HealthTech founder includes regulatory and clinical considerations that would not necessarily be relevant to someone building a conventional consumer SaaS company.
The first rule for reading an FPA report is therefore simple: do not read the number independently from the founder context against which it was generated.
The total score is an index, not a percentage grade
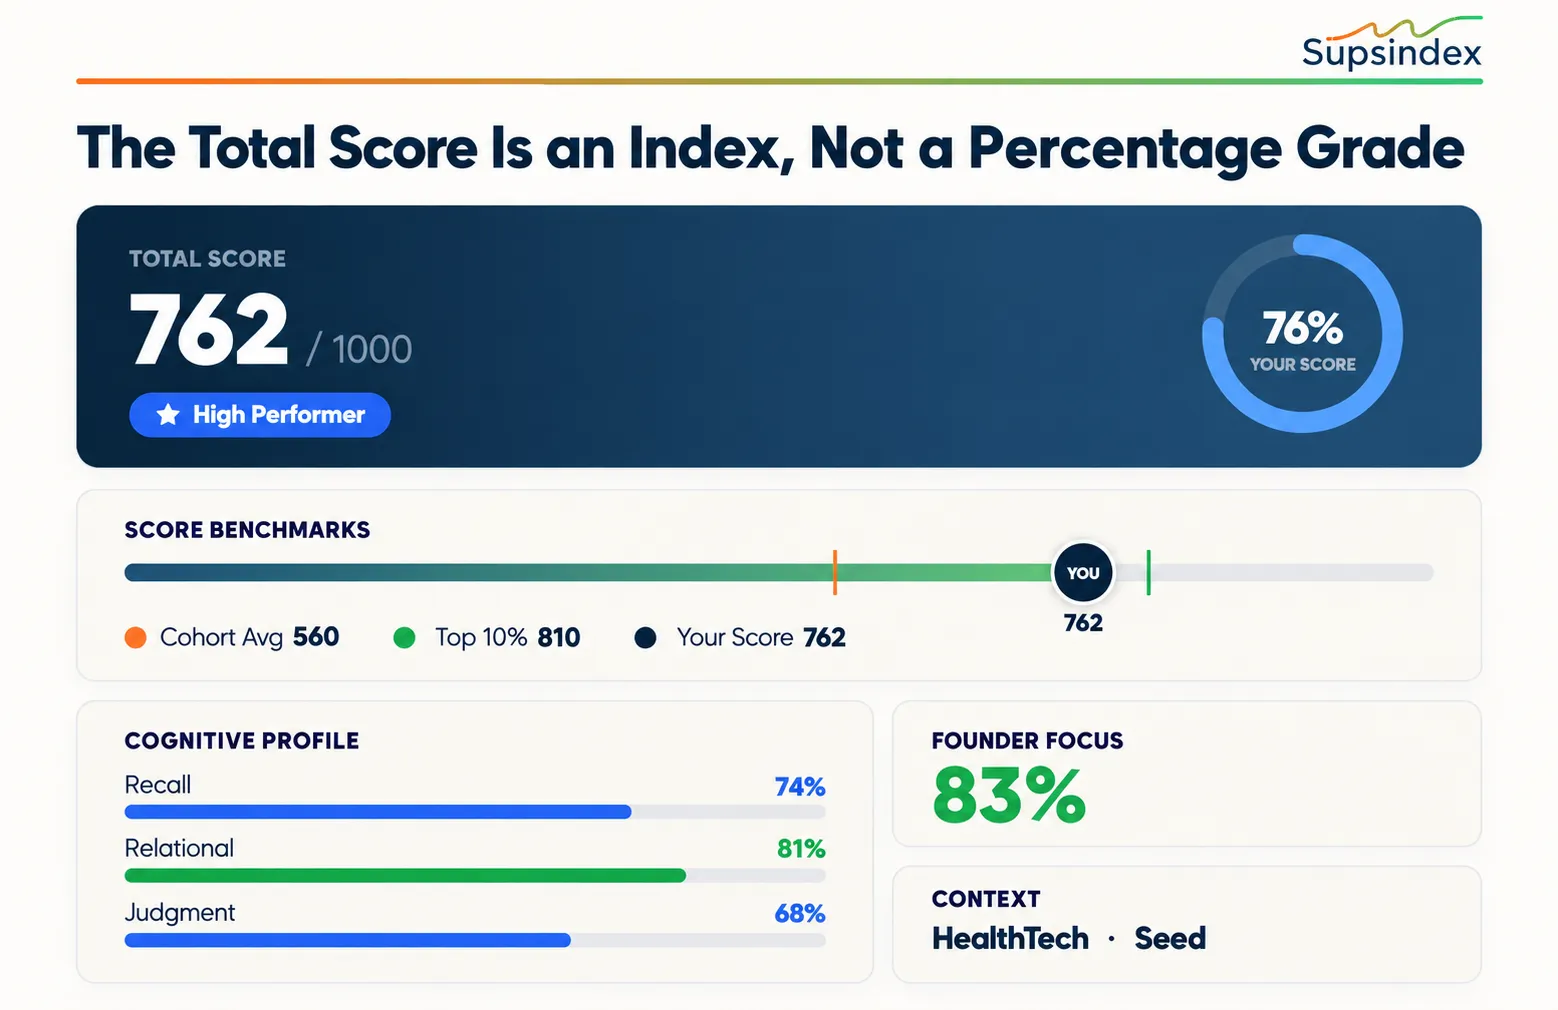
The most visually prominent number in the sample report is 762 / 1000.
It may be tempting to interpret that as 76.2% correct, as though the assessment were a conventional examination. That is not what the number represents.
The sample report’s scoring methodology describes the total as a composite built from four components: Knowledge contributes 40%, Behavioral 30%, Cognitive 20%, and Focus 10%. Supsindex’s broader FPA methodology further explains that assessment results are standardized and mapped onto a 0–1,000 FPA Index scale rather than simply displaying the percentage of questions answered correctly.
That distinction is important.
The overall score is meant to summarize several dimensions of the founder profile. It should therefore be treated as a high-level orientation point rather than the final conclusion.
A founder with a strong overall score can still possess an important weakness. In fact, some of the most useful information in the report appears precisely where the overall score stops looking impressive.
Jordan Rivera’s 762 is a good example.
The founder performs extremely strongly in several areas, yet the report identifies Legal & Compliance at 44% and Healthcare Regulatory Pathways at 39%. For a Seed-stage HealthTech founder, those weaknesses may have considerably greater operational significance than the relatively strong total score initially suggests.
This is why the report should be read from the top down, but interpreted from the details back upward.
Score, benchmark, and rank are not the same thing
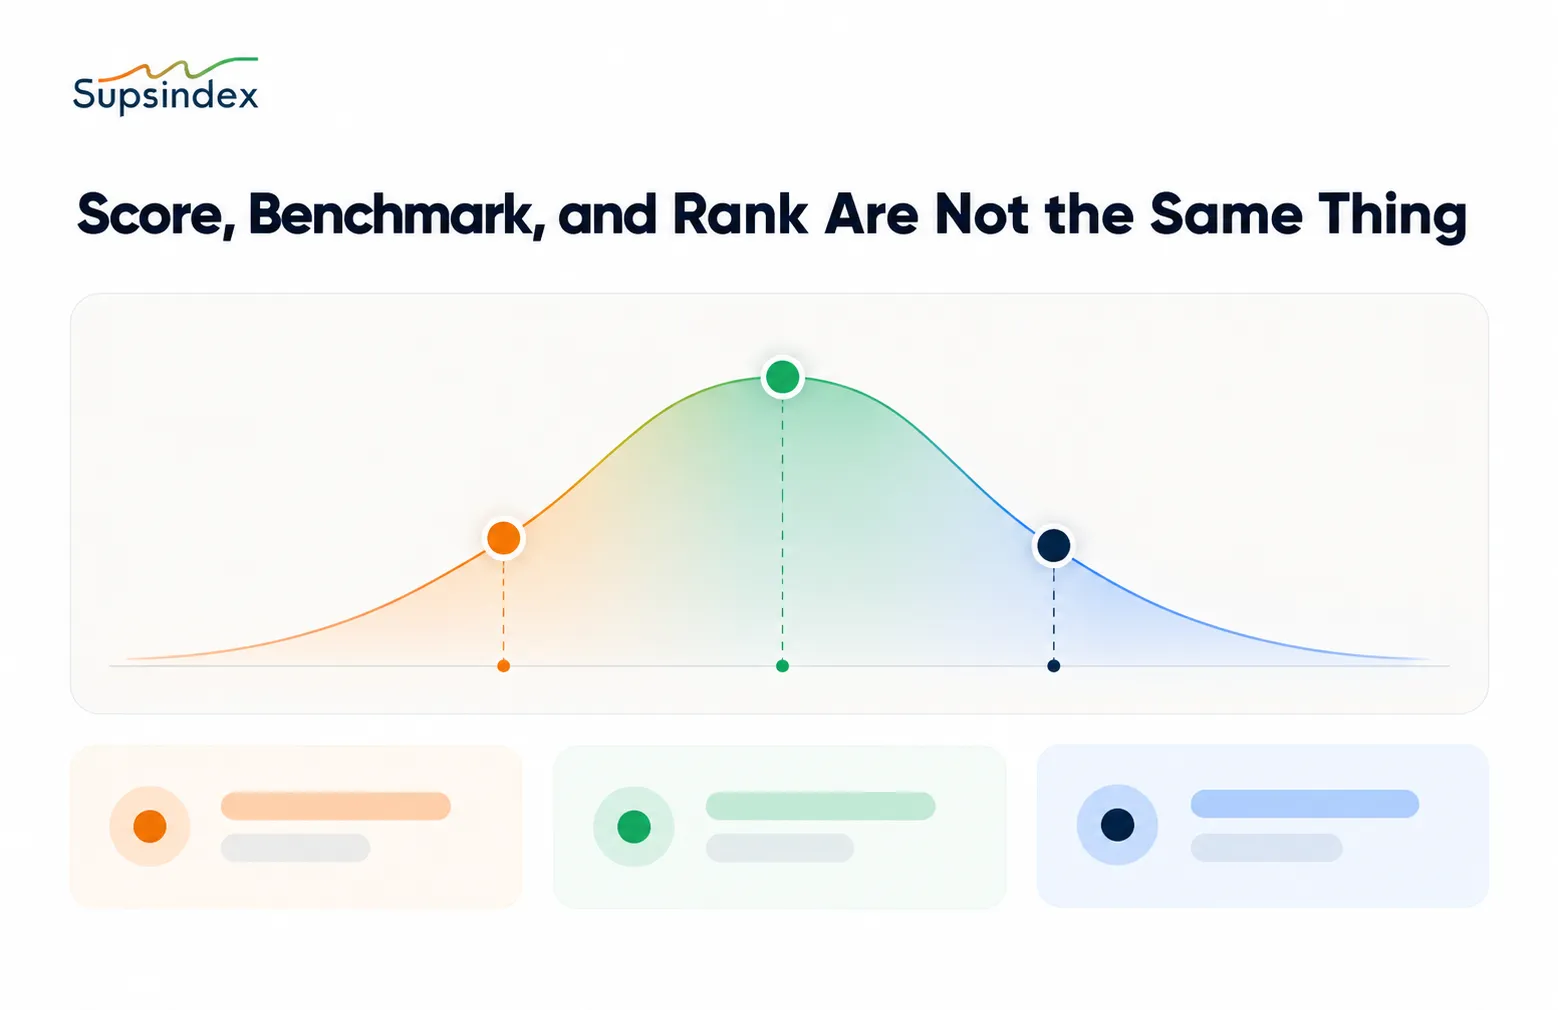
Several types of numbers appear throughout the FPA report, and mixing them together can lead to incorrect conclusions.
Your score describes your measured performance on a particular dimension. A benchmark provides a reference point showing how that performance compares with a relevant group. A quartile or ranking position describes where you sit relative to peers rather than how many questions you answered correctly.
The sample report demonstrates this clearly in its behavioral analysis.
Jordan’s Curiosity score is 88%. The cohort average is 61%, while the Top 10% benchmark is also 88%. For Ability to Delegate, the founder scores only 48%, compared with a cohort average of 53% and a Top 10% benchmark of 81%.
The 48% tells us about the founder’s own measured profile.
The 53% tells us where the relevant cohort sits on average.
The 81% shows what unusually high performance looks like in the same reporting context.
Those are three separate pieces of information.
The comparison is often more useful than the isolated number because it helps establish whether a result is relatively ordinary, unusually strong, or meaningfully behind the reference group.
Why the cohort average matters
The cohort average is one of the most useful reference points in the report.
Suppose a founder sees a score of 60%. Without context, 60 may feel mediocre. But if the relevant peer average is 42%, the interpretation changes considerably. Likewise, a score of 70% may initially look strong until the founder discovers that comparable founders average 78%.
The sample report uses this comparison repeatedly.
In Market & Customer, Jordan scores 91% while the cohort average is 66%. In Clinical Validation & Evidence, the gap is even larger: 88% versus a cohort average of 54%. In contrast, Legal & Compliance sits at 44% compared with an average of 58%, and Healthcare Regulatory Pathways is 39% compared with 57%.
This tells us much more than simply ranking the categories from highest to lowest.
Clinical Validation is not merely one of the founder’s stronger areas; it is unusually strong relative to relevant peers. Legal & Compliance is not merely one of the founder’s lower numbers; it is also 14 points below the cohort average. Healthcare regulation is an even more pronounced relative weakness.
That relative gap is where development priorities start becoming visible.
The Top 10% benchmark is a reference, not a pass mark
The sample report also displays a Top 10% benchmark throughout its analysis.
For the total score, the sample founder has 762 while the Top 10% benchmark is 810. For Market & Customer, Jordan scores 91% against 93% for the Top 10%. In Product Development, the founder sits at 85% while the Top 10% benchmark is 90%.
This benchmark should not be interpreted as a minimum acceptable standard.
Its purpose is to show what very strong peer performance currently looks like.
A founder who falls below the Top 10% line has not “failed.” In most cases, almost the entire cohort will naturally fall below a Top 10% benchmark. The useful question is whether the distance between your own result and high-performing peers reveals something worth developing.
This is particularly important because startup founders can turn benchmarking into an ego contest. The report is more useful when the comparison is treated diagnostically.
The question should not be, “Why am I not in the Top 10%?”
It should be, “What is the difference between my current capability and what stronger performers appear to demonstrate?”
Quartiles answer another question entirely
Supsindex also uses a four-quartile ranking structure: Q1 Legendary, Q2 Visionary, Q3 Architect, and Q4 Aspirant.
Under the current FPA framework, Q1 represents the top quartile of the relevant peer comparison, while the remaining quartiles progressively represent different positions within that contextual distribution. Supsindex’s current FPA documentation describes Q1 as top-quartile performance, Q2 as strong strategic literacy, Q3 as a solid structured foundation, and Q4 as foundational awareness with larger development gaps.
This is fundamentally different from saying:
“750 points means Q1 for everyone.”
Quartile placement is comparative. The purpose is to contextualize performance against relevant founders rather than establish a universal school-style pass grade.
That distinction is especially important when certificates enter the picture. Supsindex currently awards its FPA certificate to Q1 performers, meaning that certification reflects top-quartile placement within the applicable framework rather than simply assessment completion.
Not achieving Q1 should therefore not be read as failing the assessment. Supsindex itself describes the primary value of FPA as the analytical report and diagnostic baseline, including for founders who do not receive a certificate.
Do not stop at the Executive Summary
The Executive Summary tells you where to start. The Knowledge Report explains why.
The current FPA sample divides knowledge into general entrepreneurial knowledge and sector-specific knowledge. The general layer covers areas such as Market & Customer, Product Development, Finance & Fundraising, Go-to-Market, Metrics & Analytics, Operations, and Legal & Compliance. The industry layer then goes deeper into HealthTech-specific areas including Clinical Validation, Digital Health Business Models, Interoperability, and Healthcare Regulatory Pathways.
This creates one of the most useful reading patterns in the report:
overall score → category → subcategory → operational consequence.
Consider Healthcare Regulatory Pathways.
The overall category score is 39%. But the detailed report goes further, showing 36% for MDR/IVDR knowledge, 40% for CE marking and UKCA pathways, and 42% for FDA 510(k) versus PMA basics.
Now the founder has something actionable.
“Improve regulatory knowledge” is vague.
“Clarify device classification, CE/UKCA pathways, and the difference between 510(k) and PMA” is a development agenda.
The appendices therefore matter. They transform a broad weakness into something specific enough to work on.
Strengths should be audited too
Founders often approach assessment reports searching exclusively for weaknesses.
That wastes half of the information.
A strong score can indicate an existing capability that should be deliberately used rather than merely admired. The sample founder scores 91% in Market & Customer and 88% in Clinical Validation & Evidence. Within the behavioral profile, Curiosity reaches 88% and Achievement Drive 85%.
The correct interpretation is not simply, “Good, nothing to do here.”
Instead, ask how those strengths can compensate for weaker areas or create leverage.
A founder with exceptional clinical validation knowledge and strong curiosity, for example, may be unusually capable of learning the regulatory material currently missing from their profile. Strong Market & Customer understanding may also help them frame regulatory work around the requirements of actual buyers rather than treating compliance as an isolated administrative exercise.
Development is not only about repairing deficits. It is also about using existing strengths intelligently while repairing them.
Read behavioral results as tendencies, not personality labels
The FPA sample report includes a 12-trait behavioral profile covering Risk Tolerance, Achievement Drive, Spotlight Comfort, Organisation & Structure, Energy & Stamina, Emotional Management, Long-Term Orientation, Self-Efficacy, Curiosity, Resilience, Sense of Responsibility, and Ability to Delegate. The report states that these tendencies are inferred indirectly through response patterns rather than by asking founders to directly describe themselves.
This section is especially easy to misuse.
A score such as 48% Ability to Delegate should not become an identity statement like, “I am bad at delegation.”
The report itself takes a more operational approach. It identifies the result as a potential Bottleneck Risk, explains how retaining ownership too long could constrain scaling, and recommends handing over three tasks with clearly documented outcomes for 30 days.
That is exactly how the behavioral section should be read.
Trait → possible manifestation → business consequence → experiment.
The report is much less useful if a founder stops at the trait name.
Look for combinations, not isolated traits

A founder profile is not a collection of independent sliders.
Traits interact.
High Achievement Drive may be extremely productive when combined with effective delegation and good organizational structure. The same drive may generate overwork or perfectionism when the founder struggles to hand work to other people.
The sample report makes this logic visible. Jordan’s Achievement Drive is 85%, but Ability to Delegate is only 48% and Organisation & Structure is 55%, below its cohort average.
The more interesting interpretation is therefore not simply:
“Achievement is high.”
It is:
“This founder has unusually high drive but may need stronger systems for distributing execution as the organization grows.”
That is what turns assessment data into an operational hypothesis.
The cognitive profile asks how you process knowledge
FPA also separates entrepreneurial knowledge from cognitive complexity.
The sample report divides this into three levels: Recall, Relational Thinking, and Strategic Judgment. Recall concerns retrieving relevant facts and frameworks. Relational Thinking examines the ability to connect concepts across domains. Judgment concerns making difficult trade-offs when there is no obvious correct answer.
Jordan scores 74% in Recall, 81% in Relational Thinking, and 68% in Judgment.
The pattern matters more than any one number.
This founder appears especially capable of connecting information across different domains, while strategic judgment in novel or ambiguous situations offers more room for development.
That is a different diagnosis from lacking knowledge.
A founder may know what a term sheet is and remember every major clause while still struggling to make a difficult financing trade-off under uncertainty. Conversely, someone may forget technical terminology while demonstrating unusually strong strategic reasoning.
The cognitive profile helps distinguish those cases.
Founder Focus measures something different again
The Founder Focus Score in the sample is 83%, based on identifying high-signal items correctly in 10 of 12 scenarios. The report describes this as an indication of the founder’s ability to separate strategically important information from noise.
Again, this should not be merged mentally with the total FPA score.
A founder can possess substantial entrepreneurial knowledge while being easily distracted by irrelevant information. Another founder may know less overall but be extremely good at identifying which pieces of information deserve immediate attention.
In a startup environment, this distinction matters because founders constantly encounter competing signals: customer requests, investor feedback, competitor announcements, new technologies, media attention, internal metrics, and operational emergencies.
Founder Focus asks a narrower question: when information competes for your attention, how effectively do you identify what actually matters?
Scores are estimates, not perfectly precise measurements
One of the most important principles when interpreting any scientific assessment is that measurement contains uncertainty.
Supsindex’s current FPA methodology states that scores use item-information-based standard errors and that confidence intervals can vary depending on where a founder sits on the ability distribution. The methodology specifically notes that founders near the center can receive narrower intervals, while performance at the extremes may carry greater measurement uncertainty.
This means founders should resist false precision.
A score of 735 and a score of 742 should not automatically be interpreted as proof that one founder possesses meaningfully greater capability than another. Whether a numerical difference is meaningful depends on the measurement uncertainty surrounding those estimates.
The publicly available sample report focuses primarily on point scores and benchmarks and does not visibly foreground a confidence interval in the sections currently indexed. The underlying FPA methodology, however, explicitly recognizes that scores should not be treated as perfectly exact observations.
The practical lesson is straightforward: do not build a story around tiny score differences. Look for meaningful patterns, larger gaps, repeated weaknesses, and the report’s own contextual interpretation.
Treat recommendations as the bridge from measurement to action
The most important pages may not be the ones containing scores at all.
In the sample report, the Strategic Recommendations section identifies two high-impact priorities: building a stronger legal foundation before the next raise and mapping the HealthTech regulatory pathway within the first 90 days.
These recommendations emerge directly from the report’s weakest areas.
The legal recommendation connects the 44% Legal & Compliance result to practical actions such as reviewing IP assignments, employment agreements, and data-protection obligations. The regulatory recommendation connects the 39% Healthcare Regulatory Pathways score to product classification, regulatory consultation, and incorporating regulatory milestones into the funding plan.
That sequence is exactly how an FPA report should be used:
measurement → interpretation → operational action.
A report that is read once and then archived has very little developmental value.
What should you do immediately after reading your report?
The first response should not be self-defense.
A low result does not mean that Supsindex has discovered something fundamentally wrong with you as a founder. It identifies a capability, knowledge area, or response pattern that deserves further examination.
Treat the document as an epistemic audit.
Where is the report telling you something you already suspected? More importantly, where does it contradict the story you have been telling yourself?
If you believed finance was one of your strengths but your financial-modeling results sit below relevant peers, that discrepancy deserves attention. If you have always considered yourself an excellent delegator but the report identifies a recurring tendency to retain control, the useful response is not to argue with the number. It is to test the hypothesis operationally.
Data becomes valuable when it creates a question worth investigating.
Audit the report category by category
After reviewing the Executive Summary, go back through the detailed categories and create three groups.
The first contains verified strengths that can be deliberately leveraged. The second contains development areas that are weak but not immediately threatening. The third contains potential bottlenecks where a gap intersects directly with the company’s current stage, strategy, or near-term risk.
For Jordan Rivera, weak HealthTech regulatory knowledge should probably receive more urgency than a similarly sized weakness in a domain that has little immediate relevance. The company operates in HealthTech, making regulatory classification potentially consequential to product development, market entry, cost, and fundraising.
This is why founder development should not simply begin with the lowest number.
It should begin with the lowest important number.
Convert the top priorities into a 90-day operating plan
Once two or three high-priority gaps have been identified, the founder should stop thinking in terms of scores and start thinking in terms of behaviors and outcomes.
A weak financial-literacy area might lead to a weekly cash and runway review. A delegation weakness could become a 30-day experiment transferring three reversible responsibilities to another team member. A regulatory gap could lead to a formal classification review, specialist consultation, and a documented regulatory timeline.
The sample FPA report already models this approach by translating its two priority weaknesses into concrete action steps rather than simply advising the founder to “learn more.”
This is also where the report naturally connects to a broader founder-development process. The assessment creates a baseline; the next step is to determine whether behavior and capability change after intervention.
That process will be the focus of the next article in this series: How to Turn a Founder Assessment into a 90-Day Development Plan.
Use the report with your co-founders rather than privately
Individual assessment becomes more useful when it is considered in the context of the founding team.
If one founder has weak financial literacy but another founder is exceptionally strong in finance, the operational risk may differ from that of a solo founder with the same weakness. Likewise, one founder’s low delegation tendency may create a significant organizational dependency if they personally control a critical technical system.
Rather than sharing only the final score, founding teams should discuss the underlying patterns.
Where are responsibilities currently concentrated around a founder whose report suggests a bottleneck? Which weaknesses are naturally covered by another founder? Where do several founders share the same blind spot?
Supsindex’s wider assessment architecture can extend this analysis through team profiling and FEE, but the immediate value begins with an open discussion of what the individual reports actually show.
Ask for targeted guidance rather than generic advice
Assessment results also make mentorship more precise.
“Help me become a better founder” is difficult for a mentor to act on.
“My regulatory knowledge is substantially below my HealthTech peer benchmark, and I need to create a regulatory pathway before our next financing round” is different.
The same applies to SupsHub. Rather than posting a total FPA score and asking people what they think, founders can use individual findings to formulate specific questions for relevant peers or Starred Members.
The narrower the diagnosis, the more useful the advice can become.
Q1 should be used as evidence, not as an endpoint
Founders who achieve Q1 can use Supsindex’s current digital credentialing options, including the verifiable certificate and public assessment credentials. The current FPA page describes Q1 as the top 25% and makes certificate eligibility exclusive to that group.
That recognition can be useful in fundraising, accelerator applications, founder profiles, and other situations where third-party evidence of founder readiness adds context.
But Q1 should not become the end of the development process.
The report can still contain meaningful relative weaknesses even when overall performance is strong. Jordan’s sample profile illustrates exactly how a high overall result can coexist with serious domain-specific gaps.
A credential confirms a level of performance.
It does not mean development is complete.
Q2–Q4 are development positions, not failure states
The same logic applies in the opposite direction.
Q2, Q3, or Q4 should not be treated as permanent founder identities.
Supsindex describes its quartile framework diagnostically, with Q2 representing strong capability with identifiable gaps, Q3 reflecting a developing profile, and Q4 indicating larger foundational development needs.
For these founders, the most useful response is to establish a baseline, intervene deliberately, and measure again when enough meaningful development has occurred.
The question is not simply whether the next score goes up.
It is whether the founder can demonstrate that an identified bottleneck has become less operationally dangerous.
That is the logic behind continuous founder development: measurement is most useful when it creates a before-and-after trajectory.
A five-step way to read any FPA report
Although the current report contains many sections, the reading process can be reduced to five connected questions.
First, what is my context? Identify the stage, industry, ecosystem, and comparison group before interpreting performance.
Second, where do I stand overall? Use the total score and quartile as orientation, not as the final diagnosis.
Third, where are the meaningful gaps? Compare category scores with cohort averages and higher-performing peer benchmarks, then examine the subcategories producing those results.
Fourth, which gaps matter operationally right now? A weakness becomes a priority when it intersects with the company’s current decisions, stage, or risk exposure.
Finally, what behavior or capability will change because I now know this? Convert the result into an observable intervention with a timeframe.
If the report does not change what happens next, its most important value has been left unused.
The report is a starting point, not a verdict
Founder assessment becomes dangerous when people use it as a replacement for judgment.
A 762 is not a definition of a founder. Neither is Q1, Q3, an 88% Curiosity score, or a 39% regulatory score.
These are pieces of evidence.
The purpose of the FPA report is to make founder capability more visible so that founders can ask better questions about themselves, investors can evaluate human capital with additional context, and development can become more targeted than generic entrepreneurship education.
The current sample illustrates this particularly well. Jordan Rivera’s strongest domains show a founder with substantial market, product, and clinical knowledge. The weaker areas show potential exposure around legal, regulatory, organizational, and delegation capabilities. The value lies not in deciding whether Jordan is a “good founder.”
It lies in knowing what Jordan should work on next.
That is ultimately the most useful way to read a Supsindex assessment report: not as a grade, but as a map between your current capability profile and the founder you need to become next.
More Information
You can explore the current FPA Sample Assessment Report to see the complete 28-page structure, including the Executive Summary, domain-level knowledge analysis, behavioral profile, cognitive profile, Founder Focus Score, strategic recommendations, and detailed appendices.
View the FPA Sample Report
You can also review the current FPA methodology and assessment details for additional information about contextual benchmarking, quartile placement, certification, and score interpretation.
