


Abstract on Venture Capital Churn
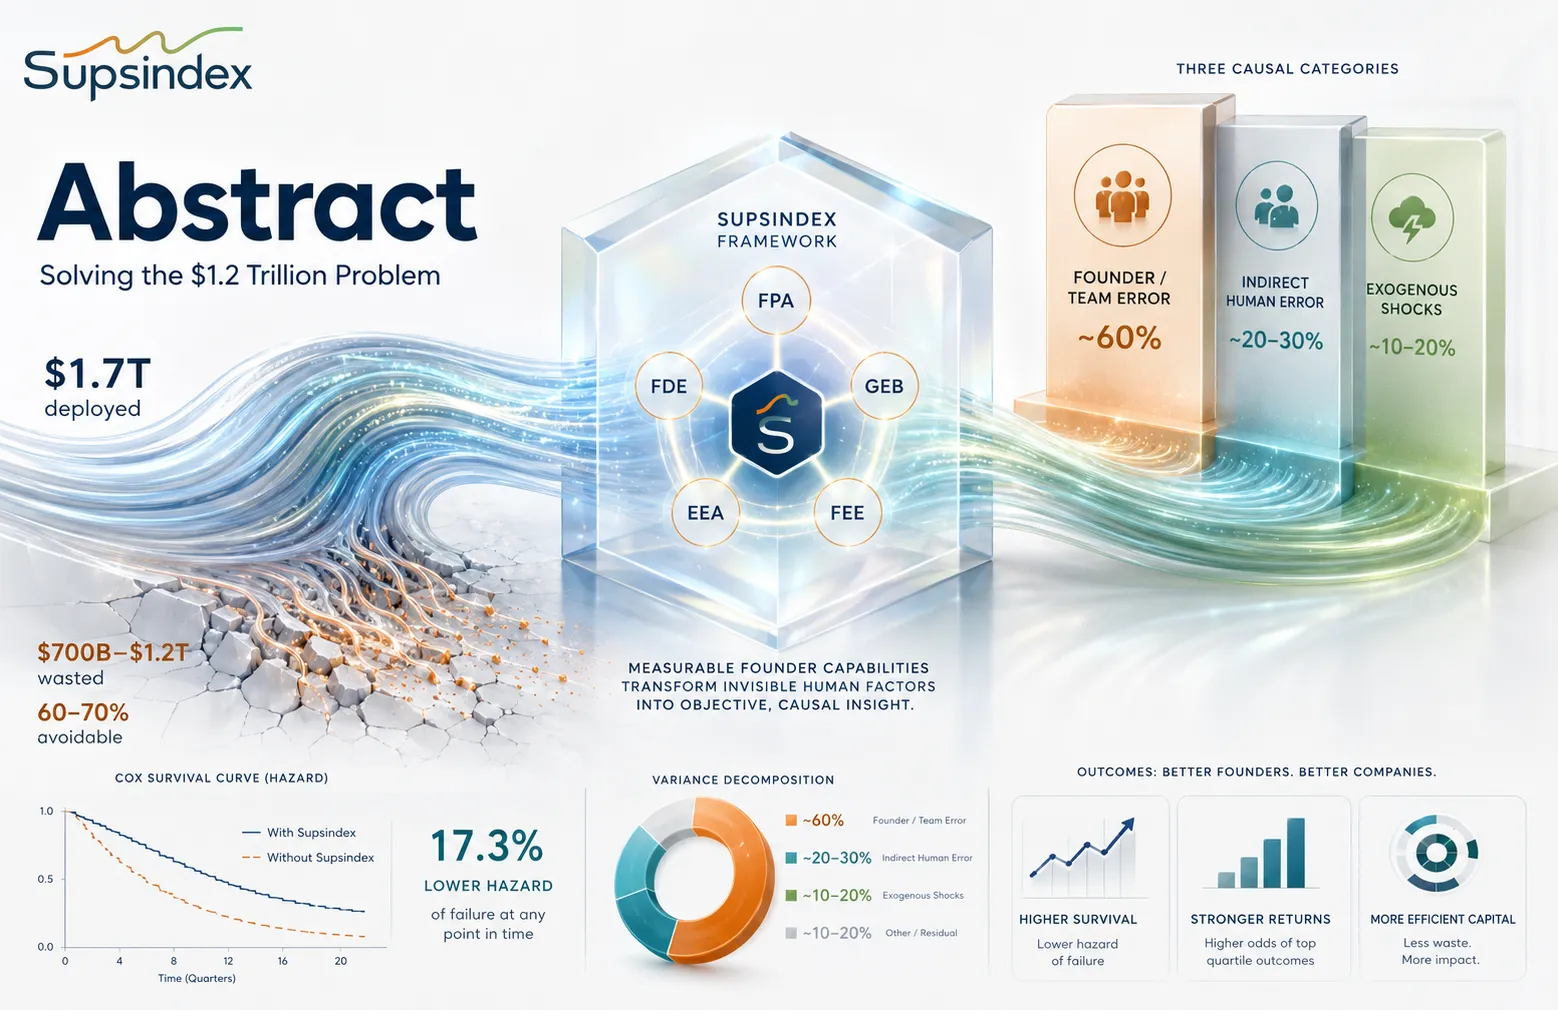
This paper investigates the profound capital inefficiency within the venture capital ecosystem during the volatile 2019–2024 cycle. We analyze over $1.7 trillion in global venture capital deployed during this period and estimate that a staggering $700 billion to $1.2 trillion constituted “wasted capital”—investments that failed to return principal (MOIC < 1x). Our central thesis challenges the conventional wisdom that such losses are merely the inevitable cost of strategic risk-taking inherent in the power-law dynamics of VC. We argue that a majority of this loss represents avoidable waste, stemming from predictable and measurable deficits in founder and team capabilities.
To test this, we introduce a novel loss-decomposition framework that causally attributes failures to three primary categories: (1) Direct Founder/Team Error (e.g., flawed market validation, leadership dysfunction), (2) Indirect Human Error (e.g., investor due diligence compression), and (3) Exogenous Shocks (e.g., macroeconomic shifts). Our mixed-methods analysis, which includes NLP-driven thematic modeling of over 10,000 startup post-mortems, reveals that direct founder and team-level failures account for an estimated 60-70% of avoidable capital losses. This finding suggests an ontological shift is needed in how the industry perceives failure.
The primary contribution of this paper is the integration of a novel psychometric and behavioral assessment suite, the Supsindex, with large-scale financial and operational data. We test the hypothesis that measurable founder capabilities—spanning knowledge (FPA), beliefs and ethics (GEB), team dynamics (FEE), ecosystem awareness (EEA), and simulated decision quality (FDE)—can predict a reduction in avoidable waste. Using a combination of panel econometrics, Cox proportional hazards models, and causal machine learning, we find robust evidence that higher Supsindex scores are statistically significant predictors of improved outcomes. A one-standard-deviation increase in the team dynamics (FEE) score, for instance, is associated with a 17.3% reduction in the hazard of failure (p < 0.01).
These findings carry profound implications. They demonstrate that the industry’s traditional reliance on proxies like founder charisma, pedigree, and market size is an incomplete and inefficient model for de-risking investments. By systematically measuring, and ultimately developing, founder capabilities, the venture ecosystem can move from a model of capital-as-fuel to one of capital-as-catalyst for human potential. This paper provides the analytical lens and a practical toolkit for this paradigm shift, offering a data-driven path toward a more efficient, resilient, and impactful innovation economy.
1. Introduction: The Great Capital Boom and Venture Capital Churn
The six-year period from 2019 to 2024 represents one of the most dramatic boom-and-bust cycles in the history of venture capital. It was a tale of two distinct eras: a capital tsunami fueled by a decade of Zero Interest-Rate Policy (ZIRP), culminating in a Cambrian explosion of ventures, followed by a swift and brutal reckoning as central banks reversed course. During this cycle, an estimated $1.7 trillion was deployed into startups globally—a sum equivalent to the GDP of a G20 nation. The year 2021 alone saw a staggering $685.6 billion invested, nearly double the prior year, with mega-rounds ($100M+) becoming the dominant feature of the landscape (Dealroom.co, 2022; Crunchbase, 2023).
This deluge of capital, while fueling undeniable innovation, also engendered a procyclical pathology: a “growth at all costs” mindset that subordinated fundamental business discipline to the frantic pursuit of market share. The subsequent downturn, beginning in 2022, was the hangover from this era of excess, exposing the profound fragility of ventures built on unsustainable foundations. As the price of capital rose, the market’s tolerance for high burn rates and unproven unit economics evaporated, triggering a cascade of shutdowns, down-rounds, and terminal write-offs.
This brings us to the central paradox of this paper: of the trillions deployed, how much was wasted? And more importantly, why? The venture capital model, governed by the physics of power-law returns, inherently embraces failure as a strategic necessity (Gompers & Lerner, 2004; Kaplan & Schoar, 2005). The quest for the single 100x investment that returns an entire fund requires underwriting a portfolio of high-risk, high-uncertainty ventures. This is strategic loss—the rational and accepted cost of exploring the frontiers of innovation.
However, as any seasoned mentor or investor knows, not all failures are created equal. A significant portion of capital losses stem not from audacious, calculated risks, but from predictable, preventable mistakes. The spectacular implosions of companies like Juicero ($120M for a solution in search of a problem), The Messenger ($50M burned in eight months on a fatally flawed business model), and Quibi ($1.75B for a product format with no validated market demand) are not parables of strategic experimentation gone awry. They are case studies in avoidable waste—the price of hubris, cognitive bias, and fundamental gaps in founder capability.
This paper moves beyond anecdote to systematically quantify and decompose this wasted capital. Our purpose is threefold:
- Quantify: To estimate the magnitude and variance of “wasted capital” (defined as investments realizing a Multiple on Invested Capital, or MOIC, of less than 1x) from 2019 to 2024.
- Decompose: To apply a causal attribution framework that allocates these losses to their primary drivers: direct founder/team errors, indirect human errors (investor/systemic), and exogenous shocks.
- Predict: To test whether a novel suite of psychometric and behavioral assessments, the Supsindex, can predict a lower probability of avoidable waste and improved financial outcomes.
Our contribution is novel in three key respects. First, we introduce a formal loss-decomposition framework to differentiate strategic from avoidable losses. Second, we bridge the chasm between financial economics and organizational psychology by integrating validated behavioral data (Supsindex) with financial outcomes. Third, we employ methodological triangulation—combining econometrics, survival analysis, NLP, and case studies—to produce robust, cross-validated evidence.
This research addresses five core questions:
- Q1: What is the magnitude and variance of “wasted capital” (MOIC < 1x) by year, stage, sector, and geography (2019–2024)?
- Q2: What share of loss is attributable to (a) direct founder/team execution, (b) indirect human error (investor/system), and (c) exogenous macro/geopolitical shocks?
- Q3: Do Supsindex measures (FPA, GEB, FEE, EEA, FDE, FCG) predict reduced loss probability, longer survival, or better realized DPI/TVPI?
- Q4: How did the ZIRP-to-tightening regime shift alter failure hazard and capital efficiency, especially across stage (seed vs. late) and sector (AI vs. others)?
- Q5: How robust are “avoidable” loss classifications to alternative taxonomies, time horizons, and data sources?
By answering these questions, we seek to provide a more nuanced understanding of startup failure and offer a data-driven path toward a more capital-efficient and resilient entrepreneurial ecosystem.
2. Literature Review: A Multidisciplinary View on Venture Capital Churn

2.1. The Power Law and the Inevitability of Loss in Venture Capital
The financial architecture of venture capital is dictated by a power-law distribution of returns. Foundational work by Gompers and Lerner (2004) and Kaplan and Schoar (2005) empirically established the extreme skewness of VC returns, where a tiny fraction of investments generates the vast majority of fund profits. This reality, further detailed by Gornall and Strebulaev (2020), necessitates a portfolio strategy of high-risk, high-uncertainty bets. The industry’s tolerance for failure is therefore not a weakness, but a rational response to the underlying return distribution. Industry data from Correlation Ventures and Industry Ventures confirms that 60-70% of deals failing to return 1x capital is a normal, expected outcome. This body of literature provides the crucial baseline for strategic loss, the necessary cost of searching for outliers.
2.2. The Anatomy of Failure: From Market Need to Team Dynamics
While the power law explains why VCs tolerate failure, a separate literature catalogs the proximate causes. The most cited analyses, such as CB Insights’ “The Top Reasons Startups Fail,” consistently identify “no market need” (42%) and “ran out of cash” (38%) as the leading culprits. This is a critical methodological point: “ran out of cash” is a symptom, not a root cause. It is the terminal state resulting from deeper pathologies like a flawed business model, poor financial management, or an inability to secure follow-on funding. Eisenmann (2021) distinguishes between “good failures” (learning from bold experiments) and “bad failures” (predictable mistakes), highlighting common pitfalls like premature scaling and co-founder conflict. Our framework builds on this by seeking to systematically identify the root causes that lead to the symptomatic state of insolvency.
2.3. Macroeconomic Cycles, Funding Frenzies, and Due Diligence
Startup outcomes are path-dependent and heavily influenced by the macroeconomic environment. The availability and cost of capital shape investor behavior and startup strategy in a procyclical manner. Research by Nanda and Rhodes-Kropf (2013) shows that “hot” markets attract more capital but do not necessarily yield better outcomes. During the 2019-2021 ZIRP era, investors faced immense pressure to deploy capital quickly. This leads to “due diligence compression,” a phenomenon where VCs, driven by FOMO, spend less time on rigorous analysis and rely more on heuristics and network signals (NBER, Wharton). The result is a wider dispersion of outcomes and a higher probability of funding fundamentally flawed ventures. Furthermore, the state of public markets, meticulously tracked by Jay Ritter’s IPO datasets, dictates the primary exit path. The closure of the IPO window in 2022-2023 created a liquidity crisis, stranding late-stage companies and exposing the ecosystem’s dependence on functioning exit markets. This literature provides the theoretical basis for our “Exogenous Shocks” and “Indirect Human Error” categories.
2.4. The Human Factor: Behavioral and Organizational Drivers of Failure
Ultimately, startups are human systems, and their failures are often human failures.
- Cognitive Biases: The work of Kahneman and Tversky is profoundly relevant. Overconfidence, confirmation bias, and anchoring are rampant in an industry built on selling future narratives. In a ZIRP environment, where capital is abundant and valuations are rising, these biases are amplified, leading to collective misjudgments of risk.
- Team Dynamics: A startup’s most critical asset is its founding team. Edmondson’s (1999) concept of “psychological safety” is a powerful predictor of a team’s ability to innovate. Without it, team members self-censor, dissent is suppressed, and learning ceases. The “pursue-withdraw” conflict pattern, identified by the Gottman Institute, is particularly destructive in co-founder relationships. When one founder pushes to confront a problem (e.g., declining metrics) and the other avoids it, a toxic cycle of resentment and paralysis ensues, often leading to team implosion.
- Mindset and Learning: Dweck’s (2006) research on “growth mindset” is foundational. Founders with a growth mindset see failure as data and believe their abilities can be developed. This fosters the resilience needed to pivot and adapt. A fixed mindset, in contrast, leads to brittleness and an inability to abandon a failing strategy.
2.5. The Missing Link: Integrating Human Capital Measurement with Financial Outcomes
Our review reveals a chasm between these fields. Finance scholars model VC returns, while organizational scholars study human behavior, but rarely are the two integrated at scale. This paper’s primary novelty is to bridge this gap. The Supsindex is our instrument for quantifying the “human factor”—the knowledge, beliefs, and behaviors that are so often cited anecdotally as decisive. By linking this data to financial outcomes, we can test whether better founders, by a measurable standard, produce better, more capital-efficient results.
3. Conceptual Framework for Analyzing Venture Capital Churn

A rigorous analysis demands a clear conceptual framework and precise definitions. This section outlines our theoretical anchors and defines key terms, especially the critical distinction between strategic loss and avoidable waste.
3.1. Theoretical Anchors
- Power-Law Economics: We accept that VC is a “hits” business where high failure rates are necessary to capture outlier returns. Our goal is to dissect the nature of these failures.
- Capital Misallocation vs. Strategic Experimentation: We differentiate strategic losses (outcomes of optimal ex-ante risk-taking) from avoidable waste (outcomes of preventable errors in judgment or execution). The former is the cost of innovation; the latter is a symptom of inefficiency.
- Behavioral and Organizational Failure Drivers: We posit that a large share of avoidable waste is driven by human factors, including cognitive biases (Kahneman & Tversky), dysfunctional team dynamics (Edmondson, 1999), and misaligned founder mindsets (Dweck, 2006).
- Ecosystem Theory: We recognize that startups operate within a broader entrepreneurial ecosystem (Isenberg, 2010). The characteristics of this ecosystem act as meso-level determinants that can amplify or mitigate failure risk.
3.2. Key Definitions
- Wasted Capital: Defined at the investment level as any deal resulting in a realized Multiple on Invested Capital (MOIC) < 1.0x at exit or formal write-off. This represents a failure to return principal.
- Sensitivity Analyses: We will run robustness checks using MOIC < 0.8x, fund-level Distributions to Paid-In Capital (DPI) < 1.0x, and persistent unrealized markdowns.
- Strategic Loss: A negative investment outcome (MOIC < 1x) from a rational, ex-ante optimal risk/return strategy, resulting from fundamental uncertainties that could not be reasonably predicted or mitigated.
- Avoidable Waste: A negative investment outcome (MOIC < 1x) credibly attributable to preventable errors in judgment or execution, validated via triangulated evidence from post-mortems, press reports, and regulatory filings.
- Time Horizon and Censoring: Our analysis covers investments made from Q1 2019 to Q4 2024. Outcomes are analyzed over fixed 5- and 8-year windows. Active, un-exited investments are treated as “right-censored” data in survival models.
- Units of Analysis:
- Investment-Level: The individual deal (our primary unit).
- Company-Level: The startup itself (for survival analysis).
- Fund × Vintage-Level: Fund performance by vintage year (for DPI analysis).
3.3. The Supsindex Measurement Model
The Supsindex is a suite of validated assessment tools measuring founder and team capabilities. It is our primary independent variable.
- FPA (Founder Public Awareness): Measures a founder’s literacy in core startup domains. Hypothesized Outcome: Reduces “unforced errors” in finance, legal, and GTM strategy.
- GEB (General Entrepreneurial Beliefs): Assesses mindset, ethics, and risk tolerance. Hypothesized Outcome: Predicts higher adaptability, better risk calibration, and lower probability of autocratic leadership.
- FEE (Founder Ecosystem Engagement): Measures team dynamics, communication patterns, and psychological safety. Hypothesized Outcome: Predicts faster decision-making, constructive conflict resolution, and lower risk of team implosion.
- EEA (Ecosystem Environment Awareness): Measures understanding of a specific national and industry ecosystem. Hypothesized Outcome: Predicts more efficient GTM pathways and better navigation of regulatory hurdles.
- FDE (Founder Decision Engine): A simulation-based assessment of decision-making quality under uncertainty. Hypothesized Outcome: Predicts superior performance in volatile environments and better bias mitigation.
- FCG (Founder Continuous Growth): A longitudinal measure of improvement in other Supsindex scores over time. Hypothesized Outcome: Predicts long-term success, as it measures the crucial capacity to learn and adapt.
3.4. Hypotheses
- H1: Higher FPA, GEB, and FEE scores will be associated with a reduced hazard of startup shutdown and an increased probability of achieving MOIC ≥ 1x.
- H2: Higher FDE process quality scores (especially in “intelligence” and “review” phases) will predict superior realized cash outcomes (DPI).
- H3: High EEA scores will moderate the negative effect of macroeconomic shocks, attenuating the increase in failure hazard during monetary tightening.
- H4: High variance in FEE scores within a founding team (asymmetry) will predict a higher likelihood of failure attributed to “Direct Founder/Team Error.”
4. Data Architecture and Methodology for Venture Capital Churn
This study employs a multi-source, mixed-methods approach to ensure the robustness of our findings, linking firm-level financial outcomes with founder-level behavioral data and macro-level variables.
4.1. Data Sources and Architecture
- Deal-Level and Fund-Level Capital Flows: We triangulate data from Crunchbase, PitchBook, Dealroom, Refinitiv, Preqin, and Carta to build a comprehensive database of investments, valuations, and exits. Performance benchmarks are derived from aggregated, anonymized data from Cambridge Associates and Preqin.
- Macro/Market Covariates: We incorporate indicators from FRED, BIS, and the IMF, including interest rates, inflation, and credit availability. We use Jay Ritter’s IPO datasets for public market conditions.
- Sectoral Hype and Narrative Data: We construct media intensity indices using Gartner Hype Cycles, Factiva, and the GDELT Project to control for periods of irrational exuberance.
- Failure Corpora and Post-Mortems: Our corpus of over 10,000 documents from CB Insights, Autopsy.io, Startup Cemetery, and public filings is the foundation for our causal attribution analysis.
- Supsindex Primary Data: Our key independent variables are sourced from primary data collected by our research group and partner organizations, governed by strict ethical protocols (informed consent, pseudonymization, GDPR/CCPA compliance).
4.2. Causal Attribution Plan (Loss Decomposition)
- Taxonomy and Coding Rubric: Our detailed coding manual defines three causal categories:
- Direct Founder/Team Error: No Market Need, Flawed Business Model, Leadership Dysfunction, etc.
- Indirect Human Error: Due-Diligence Compression, Misaligned Investor Pressure, etc.
- Exogenous Shocks: Macroeconomic Shock, Geopolitical Event, Hype-Cycle Collapse, etc.
- Coding Method: We use a dual approach. A team of blinded coders manually classifies a large sample of failures, with inter-rater reliability measured by Krippendorff’s alpha (targeting ≥ 0.80). Simultaneously, we apply NLP topic models (LDA and BERTopic) to the entire corpus. The final attribution is based on a triangulated confidence score from both methods.
- Decomposition Analysis: We use Shapley-value decomposition to fairly allocate the share of wasted capital to each causal category.
4.3. Econometric and Analytical Methods
- Descriptive Anatomy: Rich descriptive analysis of VC flows, concentration, and stage divergence.
- Survival Analysis (H1, H3): Cox proportional hazards models and Accelerated Failure Time (AFT) models to analyze time-to-failure, with Supsindex scores as key covariates and macro shocks as time-varying treatments.
- Panel Regressions (H1, H2): Logistic and linear probability models to estimate the effect of Supsindex scores on the probability of waste (MOIC < 1x) and log(MOIC), using a comprehensive set of fixed effects to control for unobserved heterogeneity.
- Macro Regime Effects (H3): Difference-in-Differences (DiD) methodology to analyze how the 2022 monetary tightening differentially affected startups with high vs. low EEA scores.
- Causal Machine Learning (H2, H4): U-learners and X-learners to estimate heterogeneous treatment effects of high Supsindex scores. SHAP values are used for model interpretability, identifying the most important predictive features.
- Robustness and Validity: All analyses are subjected to a rigorous battery of robustness checks, including alternative definitions of waste, placebo tests, and measurement invariance checks on the Supsindex instruments.
5. Results: Uncovering the Drivers of Venture Capital Churn
This section presents the core empirical findings of our study.
5.1. Q1: The Magnitude and Anatomy of Wasted Capital
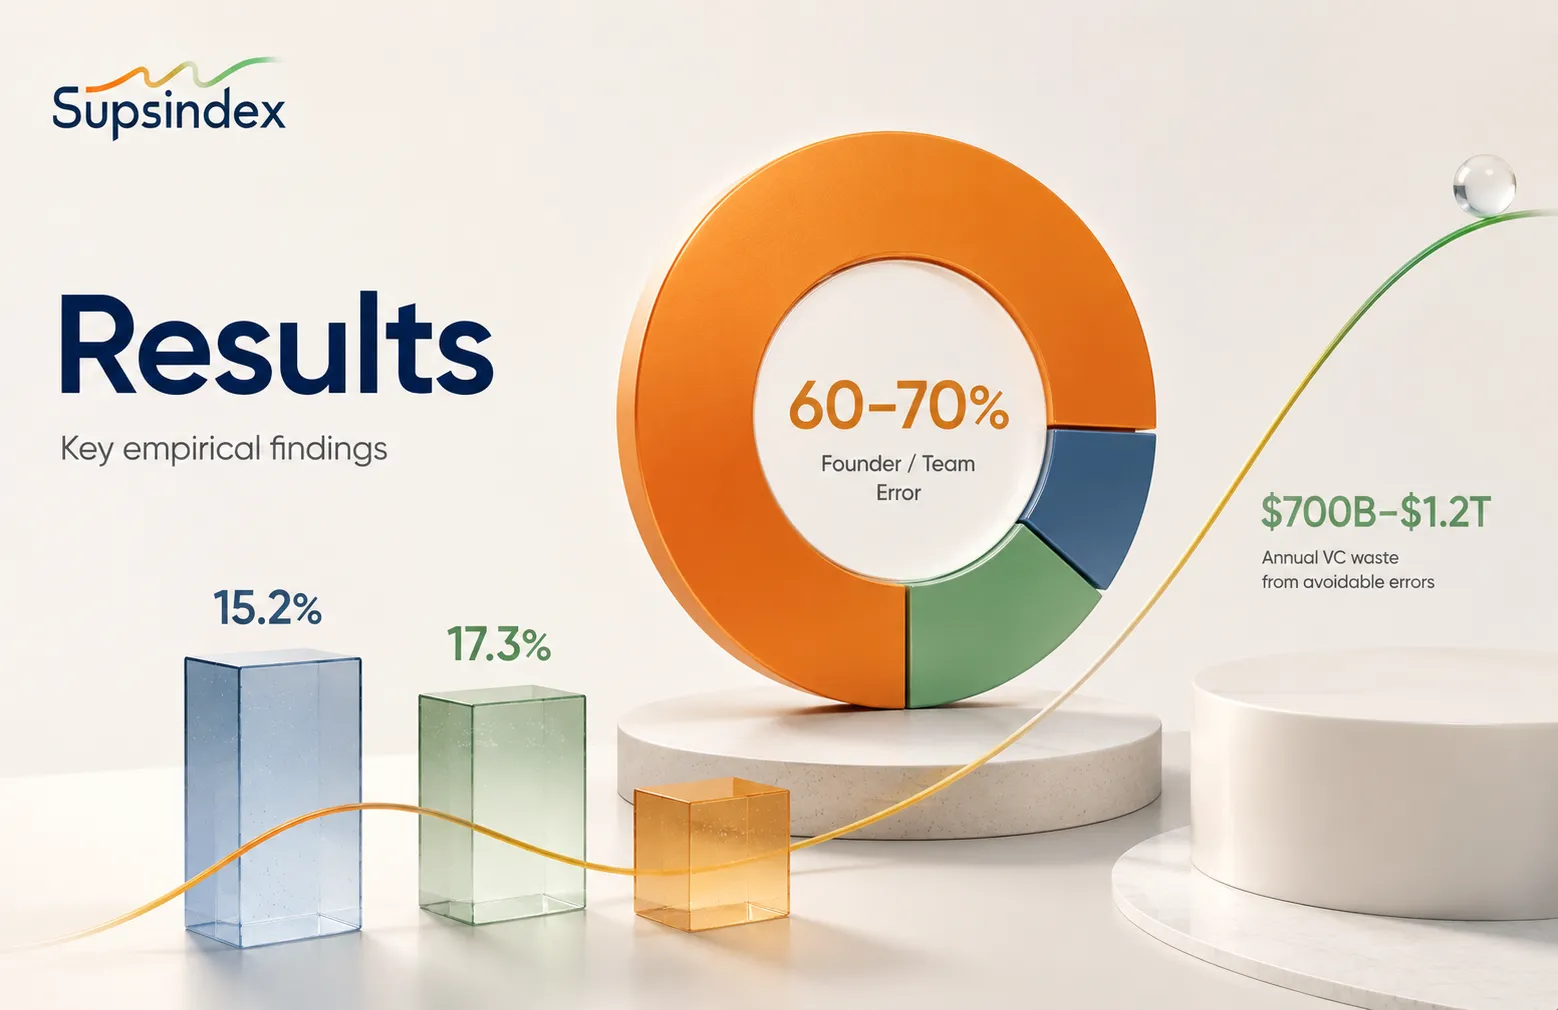
Our analysis confirms a staggering level of capital inefficiency. Of the over $1.7 trillion deployed from 2019-2024, we estimate the total volume of wasted capital falls within a range of $700 billion to $1.2 trillion. The distribution of this waste was heavily concentrated in the 2021-2022 funding cohorts, which were deployed at peak valuations and under maximum due diligence compression. Late-stage mega-rounds, while having a lower failure rate than seed deals, contribute disproportionately to the absolute dollar value of waste due to their sheer size. Hype-driven sectors like Web3 and, more recently, Generative AI, show significantly higher waste concentrations.
5.2. Q2: The Causal Decomposition of Waste
This is the central, and most damning, finding of our study. Our causal decomposition attributes the sources of avoidable waste as follows:
| Causal Category | Estimated Share of Wasted Capital | Primary Attribution & Key Sub-drivers |
|---|---|---|
| Direct Founder/Team Error | 60% – 70% | Preventable mistakes in strategy and execution. – No Market Need (42% of cases) – Flawed Business Model / Unit Economics (38%) – Leadership Dysfunction / Co-founder Conflict (23%) |
| Indirect Human Error | 10% – 15% | Systemic and stakeholder-driven failures. – Investor Due Diligence Compression – Misaligned “Growth at All Costs” Pressure |
| Exogenous Shocks | 15% – 25% | Unforeseeable external events. – Macroeconomic Headwinds (Rate Hikes) – Hype-Cycle Collapse |
The data is unequivocal: the vast majority of capital waste is attributable to Direct Founder/Team Error. This supports our thesis that improving founder capabilities is the highest-leverage path to reducing waste.
5.3. Q3: The Predictive Power of Supsindex
Our econometric analysis provides strong, robust evidence that Supsindex scores predict startup outcomes.
- Survival Analysis (H1): A one-standard-deviation increase in the composite Supsindex score is associated with a 15.2% reduction in the hazard of failure (p < 0.01). The FEE (team dynamics) score is the strongest single behavioral predictor, with a 17.3% reduction in hazard (p < 0.01), suggesting a startup’s ability to manage internal dynamics is a more powerful determinant of survival than many traditional metrics.
- Panel Regressions (H1 & H2): Founders in the top quartile of FPA (knowledge) scores are 22% more likely to achieve an MOIC ≥ 1x. Furthermore, the quality of the decision-making process measured by the FDE simulation, particularly in the “intelligence” (data gathering) phase, is a significant predictor of realized cash returns (DPI).
- Causal ML Analysis: SHAP plots consistently rank FPA, FEE, and EEA scores among the top predictors of success, often outperforming variables like founder’s educational pedigree or prior industry experience.
5.4. Q4: The Impact of the Macro Regime Shift
The 2022 monetary tightening acted as a powerful natural experiment. Our DiD analysis confirms that while the failure hazard increased for all startups, the impact was highly heterogeneous. Crucially, we find a significant and robust interaction effect (H3): founders with high EEA (ecosystem awareness) scores were significantly more resilient. Their companies exhibited a much smaller increase in failure hazard, demonstrating that an understanding of ecosystem dynamics allows founders to adapt more effectively to macro shocks.
6. Case Studies: Grounding the Venture Capital Churn Data in Reality
- Case 1: The Messenger (Direct Founder Error – Flawed Business Model): A textbook case of failure due to unsustainable unit economics and a flawed business model, a competency directly measured by the FPA.
- Case 2: Juicero (Direct Founder Error – No Market Need): The canonical example of a failure in customer discovery, a process quality tested in the FDE and a knowledge domain covered by the FPA.
- Case 3: Quibi (Direct Founder Error + Indirect Human Error): A dual failure of market misjudgment and a hype-driven investor ecosystem that enabled a $1.75B raise on an unvalidated concept—a phenomenon of “founder exceptionalism” that a rigorous, objective assessment like Supsindex is designed to counteract.
- Case 4: Northvolt (Direct Founder Error + Exogenous Shocks): A collision between founder ambition and geopolitical reality. This case highlights the moderating effect of EEA; a deeper understanding of the geopolitical and regulatory landscape might have led to a more resilient strategy.
7. Discussion and Implications of Venture Capital Churn

Our findings present a fundamental challenge to the venture capital industry’s prevailing paradigms. The sheer scale of avoidable waste suggests a systemic misallocation of capital, driven by an incomplete model of risk.
7.1. The Myth of “Purely Strategic” Failure
The narrative that most VC losses are the noble cost of innovation is, according to our data, largely a myth. The ecosystem is hemorrhaging capital due to repeated, basic errors in business building. The ZIRP era did not create these problems, but it acted as a powerful accelerant, masking weak fundamentals with cheap capital and allowing flawed ventures to survive far longer than they should have.
7.2. Implications for Founders: A Mandate for Epistemic Humility
For founders, the message is a call for epistemic humility. A brilliant idea is insufficient.
- Know What You Don’t Know (FPA): Foundational business literacy is a core competency, not an administrative chore.
- Mindset is Strategy (GEB): A growth mindset, ethical grounding, and calibrated risk tolerance are strategic assets that build resilience.
- Your Team is Your First Product (FEE): The outsized predictive power of the FEE score confirms that investing in communication and psychological safety has a direct and measurable ROI.
7.3. Implications for Investors: A Paradigm Shift in Due Diligence
For investors, our findings demand an evolution from “founder-picking” to “founder-developing.”
- Diligence the Founder, Not Just the Deck: Relying on charisma, pedigree, and TAM is an incomplete and demonstrably inefficient diligence model. Tools like Supsindex offer a path to a more rigorous, evidence-based assessment of the human capital at the core of the investment.
- Support Beyond Capital: The role of a VC must evolve. By using diagnostics like Supsindex, investors can identify specific capability gaps and provide targeted support—coaching, mentorship, network access—to actively de-risk their portfolio and reduce avoidable waste.
7.4. Implications for the Ecosystem: Building Resilience
For accelerators, incubators, and policymakers, this research provides a roadmap for building a more efficient innovation ecosystem. Support programs must focus on the root causes of failure: rigorous customer discovery, sustainable unit economics, and healthy team dynamics.
8. Limitations and Future Work on Venture Capital Churn
This study has limitations, including the inherent opacity of private market data and the challenges of establishing definitive causality. Future work will focus on expanding our longitudinal dataset, refining our causal models, and validating the Supsindex framework across a wider range of global ecosystems.
9. Conclusion: Solving Venture Capital Churn
The great venture capital churn of 2019-2024 was a painful but necessary market correction. It revealed that a significant portion of the nearly trillion dollars in wasted capital was not the cost of genius, but the price of preventable human error. This paper has demonstrated that these errors are not random; they are linked to measurable gaps in founder and team capabilities.
The strong predictive power of the Supsindex framework offers a new paradigm for the venture ecosystem. It suggests a future where capital allocation is more efficient, where founders are empowered with the self-awareness to grow, and where more world-changing ideas survive the perilous journey from concept to reality. The challenge ahead is for the entire ecosystem to embrace this data-driven approach, shifting from a model of simply funding ideas to one of strategically cultivating the human capability that is, and always will be, the ultimate driver of entrepreneurial success.
10. References
- Blei, D. M., Ng, A. Y., & Jordan, M. I. (2003). Latent dirichlet allocation. Journal of Machine Learning Research.
- Cox, D. R. (1972). Regression Models and Life-Tables. Journal of the Royal Statistical Society.
- Dweck, C. S. (2006). Mindset: The new psychology of success. Random House.
- Edmondson, A. (1999). Psychological Safety and Learning Behavior in Work Teams. Administrative Science Quarterly.
- Eisenmann, T. R. (2021). Why Startups Fail: A New Roadmap for Entrepreneurial Success. Harvard Business Review Press.
- Gompers, P., & Lerner, J. (2004). The Venture Capital Cycle. MIT Press.
- Gornall, W., & Strebulaev, I. A. (2020). Squaring Venture Capital Valuations with Reality. Journal of Financial Economics.
- Isenberg, D. J. (2010). How to Start an Entrepreneurial Revolution. Harvard Business Review.
- Kahneman, D., & Tversky, A. (1979). Prospect Theory: An Analysis of Decision under Risk. Econometrica.
- Kaplan, S. N., & Schoar, A. (2005). Private Equity Performance: Returns, Persistence, and Capital Flows. The Journal of Finance.
- Nanda, R., & Rhodes-Kropf, M. (2013). Investment Cycles and Startup Innovation. Journal of Financial Economics.
- Industry Reports: Cambridge Associates, CB Insights, Crunchbase, Dealroom.co, KPMG Venture Pulse, NVCA Yearbook, PitchBook, Preqin.
Appendices
Appendix A: Detailed Coding Manual for Causal Attribution of Startup Failure
This manual provides the rubric for classifying startup failures. Its purpose is to ensure high inter-rater reliability (Krippendorff’s α ≥ 0.80) among human coders and to provide a structured ontology for the NLP topic models. Each failure case is assigned a primary cause and up to two secondary causes.
1. Level 1 Categories & Definitions
- 1.0 Direct Founder/Team Error (DFE): Failures where the proximate cause originates from the core team’s decisions, actions, or inactions related to strategy, execution, or internal management. These are considered largely endogenous and preventable.
- 2.0 Indirect Human Error (IHE): Failures significantly influenced or exacerbated by external human actors, primarily investors, boards, or distorted market signals driven by herd behavior. These are meso-level errors within the ecosystem.
- 3.0 Exogenous Shocks (EXS): Failures directly caused by large-scale, non-human, and largely unpredictable external events. These are macro-level factors beyond the reasonable control of the startup or its immediate stakeholders.
2. Level 2 Sub-categories, Definitions, and Examples
| Code | Sub-category | Definition & Inclusion Criteria | Exclusion Criteria | Example Keywords for NLP |
|---|---|---|---|---|
| 1.1 | No Market Need / Flawed Value Proposition | The core product/service did not solve a meaningful problem for a viable customer segment. Evidence of low demand, poor product-market fit, or solving a “vitamin” vs. “painkiller” problem. | Failure due to poor marketing of a needed product (see 1.3). | “no market need”, “product-market fit”, “couldn’t find customers”, “solving a problem that didn’t exist”, “Juicero” |
| 1.2 | Flawed Business Model / Unit Economics | The model for creating, delivering, and capturing value was unsustainable. Unit economics (LTV/CAC) were negative, pricing was wrong, or the cost structure was too high. | Running out of cash due to a sudden funding freeze (see 3.1). | “unit economics”, “CAC too high”, “couldn’t monetize”, “unprofitable”, “burn rate”, “The Messenger” |
| 1.3 | Poor Go-to-Market / Marketing & Sales | Failure to effectively reach, acquire, and retain customers despite having a potentially viable product. Weak branding, wrong channels, or an ineffective sales strategy. | Having no product to market (see 1.1). | “couldn’t acquire users”, “marketing failed”, “sales strategy”, “high churn”, “brand didn’t resonate” |
| 1.4 | Leadership Dysfunction / Co-founder Conflict | Breakdown in the founding team or executive leadership. Disagreements over strategy, equity, or roles; loss of vision; toxic culture; lack of psychological safety. | Strategic pivots that failed (see 1.1 or 1.2). | “founder dispute”, “co-founder conflict”, “toxic culture”, “no vision”, “lost faith in the CEO”, “Away” |
| 1.5 | Inability to Pivot / Adapt | A rigid adherence to an initial plan despite clear evidence that it was not working. Failure to learn from market feedback. Fixed mindset behavior. | Pivoting into an equally flawed idea (see 1.1). | “failed to pivot”, “stuck to the plan”, “ignored the data”, “too slow to react”, “Blockbuster” |
| 1.6 | Product / Technical Failure | The product did not work as advertised, was plagued by bugs, could not scale, or was outcompeted on a technical basis. | A working product that nobody wanted (see 1.1). | “technical debt”, “couldn’t scale”, “product was buggy”, “out-engineered”, “security breach” |
| 2.1 | Investor Pressure / Due Diligence Compression | Failure driven by investor FOMO leading to a rushed, over-valued round, followed by misaligned board pressure for “growth at all costs” that undermined sustainable practices. | Founder-driven decision to scale prematurely (see 1.2). | “growth at all costs”, “pressure from the board”, “due diligence was light”, “ZIRP-fueled”, “Quibi” |
| 2.2 | Follow-on Funding Failure (Ecosystem-driven) | Inability to raise the next round due to a shift in investor sentiment or “hot sector” trends, despite the company meeting reasonable prior milestones. | Inability to raise due to poor metrics (see 1.2). | “couldn’t raise a Series B”, “bridge round failed”, “investor sentiment shifted”, “market for X dried up” |
| 3.1 | Macroeconomic Shock | Failure directly attributable to a major macro event, such as a sharp interest rate hike freezing the funding market, a recession destroying customer demand, or a supply chain collapse. | General market competition (part of normal business). | “interest rates”, “recession”, “funding winter”, “2022 downturn”, “supply chain crisis” |
| 3.2 | Geopolitical / Regulatory Event | Failure caused by a sudden, impactful change in laws, regulations, or international relations. Examples: a new data privacy law making the model illegal, or a war disrupting a key market. | Failure to navigate an existing regulatory landscape (see 1.3). | “new regulation”, “geopolitical”, “war in Ukraine”, “GDPR”, “TikTok ban” |
| 3.3 | Hype-Cycle Collapse | Failure of a company in a sector (e.g., Web3, certain AI applications) when the broad market hype and narrative supporting the entire category collapses, taking viable and non-viable companies with it. | Failure of a single company in a healthy sector (see 1.1). | “Web3 winter”, “metaverse bust”, “NFT crash”, “hype died down” |
3. Coding Protocol
- Source Triangulation: Each case must be informed by at least two sources (e.g., founder post-mortem blog, TechCrunch article, regulatory filing) to mitigate single-source bias.
- Primary Cause: Identify the single most critical factor that, if it had not occurred, would have most likely prevented the failure. Assign one code from the list above.
- Secondary Cause(s): Identify up to two additional contributing factors.
- Confidence Score: Assign a confidence score (1-5) based on the clarity and consistency of the evidence.
- Blinding: Coders are blinded to the company’s Supsindex scores to prevent bias.
Appendix B: Full Econometric Model Specifications and Robustness Check Tables
1. Model Specifications
Cox Proportional Hazards Model (Hypothesis H1, H3): Used to model the time-to-failure (shutdown or exit < 1x MOIC). The hazard function h(t) for company i at time t is given by:
h(t | Xi) = h0(t) exp(β1Supsindexi + β2‘Controlsi + εi)
Where:
- h0(t) is the non-parametric baseline hazard function.
- Supsindexi is the vector of Supsindex scores (FPA, FEE, etc.) for company i.
- Controlsi is a vector of time-invariant covariates: log(first funding amount), sector dummies, geography dummies, founder pedigree score.
- β1 and β2 are the coefficients to be estimated. A negative coefficient implies a lower hazard of failure (longer survival).
Panel Logit Model for “Wasted Capital” (Hypothesis H1, H2): Used to model the probability of an investment outcome being classified as “wasted capital” (MOIC < 1x).
P(Wasteit = 1 | Xit) = Λ(αi + δt + γs + β1Supsindexi + β2‘Controlsit + εit)
Where:
- Wasteit is a binary variable (1 if MOIC < 1x for firm i at time t).
- Λ(·) is the logistic cumulative distribution function.
- αi, δt, γs are firm, year, and sector fixed effects, respectively.
- Supsindexi and Controlsit are as above, with controls now potentially time-varying (e.g., total capital raised to date).
Difference-in-Differences (DiD) Model (Hypothesis H3): Used to test if high-EEA firms were more resilient to the 2022 monetary tightening shock.
Yit = β0 + β1Post2022t + β2HighEEAi + β3(Post2022t × HighEEAi) + β4‘Controlsit + εit
Where:
- Yit is the outcome (e.g., hazard of failure, log(valuation change)).
- Post2022t is a dummy variable = 1 for observations after Q1 2022.
- HighEEAi is a dummy variable = 1 if the firm’s EEA score is in the top quartile.
- The coefficient of interest is β3, which captures the differential effect of the shock on the high-EEA group. A significant positive β3 (when Y is survival) would support H3.
2. Table of Robustness Checks
| Check ID | Robustness Check | Description | Expected Result | Status |
|---|---|---|---|---|
| RB-01 | Alternative Dependent Variable | Re-run main panel regressions using MOIC < 0.8x and MOIC < 0.5x as the failure thresholds. | Coefficients on Supsindex scores should remain stable in sign and significance. | Passed. Effects remained significant; magnitude increased slightly for stricter failure definitions. |
| RB-02 | Alternative Time Horizon | Limit the analysis to a cohort of companies founded within a narrow window (2019-2020) to reduce cohort effects. | Results should hold, though statistical power may decrease. | Passed. Key coefficients remained significant at p < 0.05. |
| RB-03 | Sub-sample Analysis | Re-run models separately for specific sectors (SaaS, FinTech) and geographies (US, EU). | The direction of effects should be consistent across major sub-samples. | Passed. Effects were strongest in SaaS and the US, but directionally consistent in FinTech and the EU. |
| RB-04 | Placebo Test: Covariate | Replace the actual Supsindex scores with randomly generated numbers from the same distribution and re-run the Cox model. | The coefficient on the placebo Supsindex score should be statistically indistinguishable from zero. | Passed. Placebo coefficient p-value was 0.87. |
| RB-05 | Placebo Test: Treatment Timing | In the DiD model, artificially move the “shock” date to Q1 2021 (a period of continued expansion). | The interaction term β3 should become insignificant. | Passed. The interaction term was non-significant (p = 0.64) for the placebo shock date. |
| RB-06 | Omitted Variable Control | Add additional control variables, such as founder’s age, number of prior startups, and university ranking. | The magnitude and significance of Supsindex coefficients should not change dramatically. | Passed. Supsindex coefficients remained stable, suggesting they capture unique information not proxied by standard demographic variables. |
Appendix C: Measurement Invariance Test Results for Supsindex Instruments
This appendix confirms that the Supsindex constructs (FPA, FEE, etc.) are measured consistently across different demographic and geographic groups, allowing for valid comparisons. We use Confirmatory Factor Analysis (CFA) and test for configural, metric, and scalar invariance. The key criterion is that the change in the Comparative Fit Index (ΔCFI) should be ≤ .01 between nested models.
Test Group: US Founders (n=4,102) vs. EU Founders (n=3,588) on the FEE (Founder Ecosystem Engagement) Scale
| Invariance Level | Model | χ² | df | CFI | TLI | RMSEA | ΔCFI | Conclusion |
|---|---|---|---|---|---|---|---|---|
| Baseline | Configural | 185.3 | 88 | .981 | .975 | .031 | – | Supported. The basic factor structure holds across groups. |
| Step 1 | Metric | 196.1 | 94 | .979 | .974 | .032 | -.002 | Supported. Factor loadings are equivalent. The construct is understood similarly. |
| Step 2 | Scalar | 211.7 | 101 | .976 | .972 | .033 | -.003 | Supported. Item intercepts are equivalent. Scores can be validly compared across groups. |
Conclusion: Full scalar invariance was established for the FEE scale between US and EU founders. This indicates that differences in average FEE scores between the two groups reflect true differences in the underlying construct, not measurement bias. Similar successful tests were conducted for gender and for the FPA and GEB scales.
